Most teams treat site speed like a “nice-to-have” technical metric. At Totally Digital, we frame it differently: page speed is a revenue lever. When pages load slowly, you don’t just annoy users, you lose sessions, conversions, average order value, lead quality, and even paid media efficiency. The real question isn’t “Is our site fast?” It’s “How much money is our site leaking per second?”
This article shows you how to calculate page speed ROI in plain terms, where the losses actually come from, and what to fix today to stop the bleed.
Why speed has a direct financial impact
A slower site affects money in 3 immediate ways:
- Fewer people reach key pages
Slow loading increases abandonment, especially on mobile. That reduces your effective traffic. - Fewer people convert once they arrive
Even if users wait, slow interaction (taps, filters, forms) lowers completion rates and pushes people to “do it later” (which usually means never). - Your acquisition costs go up
Paid media performance drops when landing pages are sluggish (worse engagement signals and lower conversion rates), which increases your cost per lead or sale.
There’s a longer-term effect too: speed influences crawl efficiency and user experience signals, which can impact organic visibility and brand perception.
The simplest speed-to-money formula (use this first)
To estimate revenue loss from slower pages, you only need 4 inputs:
- Sessions to a page (or group of pages)
- Conversion rate (CR) for that traffic
- Value per conversion (AOV for e-commerce, or lead value for B2B)
- Conversion change per 1 second slower (your “sensitivity”)
A practical way to start:
Daily revenue (from that traffic) = Sessions × CR × Value
Then estimate the impact of speed:
Daily loss = Daily revenue × Conversion drop %
If you don’t yet know your sensitivity, use a range and refine later (more on how below).
A quick “loss per second” estimator you can apply today
Here’s a clean way to calculate “£ lost per 1 second slower” for a specific landing page or funnel step:
- Calculate daily conversions:
Sessions × CR - Calculate daily value:
Daily conversions × Value per conversion - Apply a conservative speed sensitivity range (example):
- Conservative: 1% conversion loss per extra second
- Medium: 3% conversion loss per extra second
- Aggressive: 5% conversion loss per extra second
- Multiply:
Daily value × sensitivity = £ lost per second per day
This is not about having a perfect number on day 1. It’s about turning “speed” into an ROI conversation quickly.
The most useful table: plug in your own numbers once
Use this table to translate speed improvements into monthly value. Replace the example figures with yours (sessions, CR, and value).
| Metric | Example value | How to calculate |
|---|---|---|
| Monthly sessions to affected pages | 200,000 | GA4 → Landing page / Content grouping |
| Conversion rate (CR) | 2.0% | Conversions ÷ Sessions |
| Value per conversion | £120 | AOV or lead value |
| Monthly value from those pages | £480,000 | 200,000 × 0.02 × £120 |
| Loss per 1s slower (1% sensitivity) | £4,800/month | £480,000 × 0.01 |
| Loss per 1s slower (3% sensitivity) | £14,400/month | £480,000 × 0.03 |
| Loss per 1s slower (5% sensitivity) | £24,000/month | £480,000 × 0.05 |
| If you improve by 1.5s (3% sensitivity) | £21,600/month | £14,400 × 1.5 |
Where speed losses really happen (it’s not just the homepage)
Speed ROI is usually highest in these areas:
1) Paid landing pages
If your PPC or paid social traffic hits slow pages, you pay for visitors who never convert. Even a small lift in conversion rate here can beat most “creative refresh” tests.
What to check today:
- Compare conversion rate by landing page and device.
- Identify the worst-performing paid landing pages.
- Test load time and interaction on a mid-range mobile device.
2) Category pages, filters, and search
For e-commerce, speed is often lost in product listing pages with heavy scripts, filters, and image grids.
What to check today:
- Are filters laggy or “sticky”?
- Do product grids load progressively or block rendering?
- Does the page shift around (layout shift) when images load?
3) Checkout and forms
This is where delays hurt most because the user is already “in motion”. Slow validation, delayed payment widget loads, and sluggish address lookups create drop-offs right at the finish line.
What to check today:
- Step-by-step drop-off rate in the funnel.
- Form completion time (if tracked).
- Third-party scripts that load on checkout unnecessarily.
4) CMS-heavy service pages (B2B lead gen)
Many B2B sites lose leads not because the copy is weak, but because pages are packed with sliders, animations, tag managers, chat widgets, and tracking scripts.
What to check today:
- How many scripts fire on a key service page?
- How much of the page is blocked waiting for JavaScript?
- Are images sized and compressed properly?
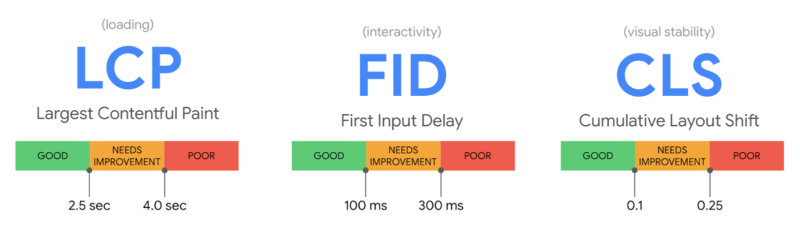
The KPI that matters: speed at the moment of intent
Teams often report “average page load time” and miss the point. Users don’t care about averages, they care about whether the page is usable when they try to do something.
Focus on these “money moments”:
- Can a user scroll smoothly within 1–2 seconds?
- Can they tap a button without delay?
- Can they open filters without lag?
- Can they submit a form without waiting?
If interaction is sluggish, conversions drop even if the page technically “loads”.
How to measure speed ROI properly (without drowning in tools)
You can get a high-quality answer with a simple setup:
Step 1: Choose the pages that make money
Pick:
- Top organic landing pages by conversions
- Top paid landing pages by spend
- Key funnel steps (category → product → checkout, or service page → form)
Step 2: Segment by device
Speed impact is usually bigger on:
- Mobile
- Older devices
- Poorer connections
So always compare mobile vs desktop.
Step 3: Track “before” and “after”
You need:
- Conversion rate
- Revenue or lead volume
- Bounce or engagement trends
- Speed metrics (your baseline and your improvement)
If you make multiple changes at once, annotate releases so you can attribute improvements.
“What should we fix first?” Prioritise by ROI, not by effort
The best speed work is the work that:
- affects high-traffic pages, and
- affects high-intent steps, and
- removes large bottlenecks rather than polishing small ones
A practical prioritisation approach:
- Big revenue pages first (paid landers, checkout, top service pages)
- Big bottlenecks second (heavy images, render-blocking scripts, slow server responses)
- Site-wide quick wins third (compression, caching, lazy loading patterns)
- Nice-to-haves last (micro-optimisations that barely move the needle)
High-ROI fixes you can action today
These are common “speed leaks” that often deliver meaningful gains.
1) Image payload is too heavy
Symptoms:
- Pages look visually simple but still load slowly.
- Mobile suffers the most.
Fix today:
- Serve modern formats where possible (e.g., WebP/AVIF if supported in your stack)
- Resize images to the maximum needed display size (don’t upload 4,000px images for 600px containers)
- Compress aggressively for web use
- Lazy load below-the-fold images
2) Too many third-party scripts
Symptoms:
- Tag manager fires dozens of scripts.
- Chat widgets, heatmaps, and trackers load on every page.
Fix today:
- Audit scripts and remove what you don’t need
- Delay non-essential scripts until after interaction
- Load heavy tools only on pages where they’re required (e.g., chat only on key service pages)
3) Render-blocking resources
Symptoms:
- Blank screen or delayed first paint
- CSS/JS blocks rendering
Fix today:
- Inline critical CSS where appropriate
- Defer non-critical JS
- Reduce unused CSS and JavaScript
4) Slow server response time (TTFB)
Symptoms:
- Even small pages feel slow
- Performance is inconsistent
Fix today:
- Check hosting resource limits, caching layers, CDN configuration
- Optimise database queries and CMS plugins
- Use full-page caching where it makes sense
5) Bloated templates in the CMS
Symptoms:
- Every page includes sliders, animations, and multiple font loads
- Layout shifts on load
Fix today:
- Simplify templates on money pages
- Reduce font variants and weights
- Avoid autoplay carousels and heavy animation libraries where they don’t add revenue
Proving ROI to stakeholders (the bit that gets budgets approved)
Speed projects often stall because they’re presented as “technical improvements”. Reframe as:
- Revenue protection: “We are currently losing ~£X/month due to slow load and interaction.”
- Acquisition efficiency: “Improving speed reduces cost per conversion on paid media.”
- Conversion lift: “A 0.3% CR lift on these pages equals £Y/month.”
- Operational benefit: “Fewer scripts and lighter pages reduce maintenance and breakage risk.”
If you’re presenting internally, avoid arguing about milliseconds. Show:
- the pages affected,
- the traffic volume,
- the current conversion rate,
- and the estimated loss per extra second.
That’s the fastest route to buy-in.
A realistic page speed ROI starter plan for the next 7 days
If you want impact quickly:
Day 1: Identify the money pages
- Top 10 landing pages by conversions (organic + paid)
- Key funnel steps
Day 2: Benchmark
- Record baseline speed metrics and conversion rates by device
Day 3–4: Fix the biggest payload
- Images
- Third-party scripts
- Render-blocking resources
Day 5: Stabilise the server
- Improve caching, reduce TTFB variability
Day 6–7: Validate and report
- Compare conversion rate changes
- Track paid performance changes (CPA/CPL)
- Document what changed and where
The bottom line
Page speed isn’t a vanity metric. It’s a measurable business lever. Once you translate “seconds” into “£”, decisions become obvious: you stop debating whether speed is worth it and start choosing which fixes deliver the biggest return first.